Executive Summary
The consensus economic outlook for Australia has materially shifted over the June quarter. The narrative has solidified around a “soft landing,” with inflation forecasts revised downwards and the Reserve Bank of Australia (RBA) adopting a more dovish stance. However, beneath this surface-level optimism lies a decoupling that presents both opportunities and threats to shareholder value.
The most important development is the divergence between short-term monetary policy, which is now clearly easing, and long-term capital costs, which remain high. This steepening yield curve, combined with a pessimistic revision to consumer spending forecasts, creates a complex valuation landscape. While the cost of short-term debt may fall, the fundamental drivers of long-term value—sustainable cash flow growth and the risk profile of those cash flows—are now subject to new and conflicting pressures.
This edition of our newsletter will dissect these shifts and translate them into their direct impact on the three pillars of valuation: the cost of capital (WACC), operating cash flows and Terminal Value.
Domain 1: The Cost of Capital – The Foundation of Value
The market’s view on interest rates has bifurcated. While the RBA has signalled a clear easing cycle, the long-term cost of capital has not followed suit. This has direct and nuanced implications for Weighted Average Cost of Capital (WACC) calculations.
The Shift (What):
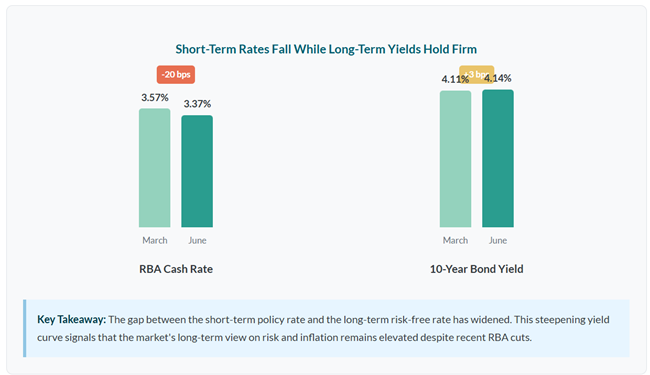
- RBA Cash Rate: The consensus forecast for the year-end 2025 RBA Cash Rate has been revised down by 20 basis points, from 3.57% in the March report to 3.37% in the June report. This follows an actual rate cut by the RBA to 3.85% in May.
- 10-Year Government Bond Yield: In stark contrast, the forecast for the long-term risk-free rate has held firm, ticking up slightly from 4.11% to 4.14% for year-end 2025.
The Valuation Impact (So What):
- Divergent Impact on WACC: The fall in the RBA cash rate will provide relief to companies with high levels of floating-rate debt, directly lowering their cost of debt. However, the stickiness of the 10-year yield -the foundational component of the risk-free rate (Rf) in the cost of equity calculation (ke =Rf +β(ERP)) – means that the cost of equity will likely remain elevated.
A Steeper Yield Curve Signals Risk: It suggests the market is pricing in either persistent long-term inflation or a higher “term premium” to compensate for future economic uncertainty and government borrowing. Boards and company management must challenge the assumption that a dovish RBA automatically translates to a lower overall WACC. The structure of a company’s balance sheet and the market’s assessment of long-term risk are now more critical determinants of the discount rate.

Domain 2: The Operating Environment & Cash Flows – The Engine of Value
While inflation and unemployment forecasts have improved, creating potential tailwinds for corporate margins, the outlook for the Australian consumer has soured. This puts revenue growth—the primary driver of cash flow—under a cloud of uncertainty.
The Shift (What):
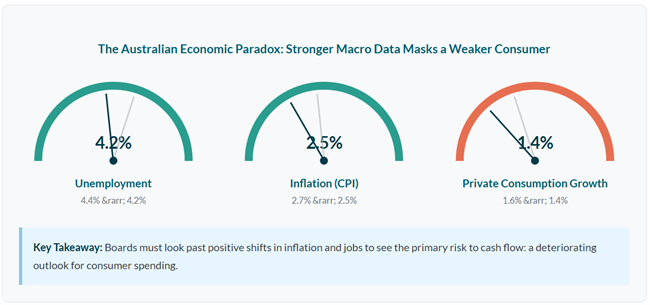
- Inflation (CPI): The 2025 average inflation forecast has moderated from 2.7% to 2.5%, bringing it within the RBA’s target band.
- Unemployment: The labour market is now expected to be tighter, with the 2025 unemployment forecast improving from an average of 4.4% to 4.2%.
- Private Consumption: Despite lower inflation and a stronger job market, the forecast for 2025 private consumption growth has been downgraded from 1.6% to 1.4%.
The Valuation Impact (So What):
- Margin Relief vs. Revenue Pressure: The lower inflation forecast suggests a potential easing of input cost pressures, which is a positive for operating margins. However, the downgrade to private consumption—which constitutes around half of GDP —is a significant headwind for top-line revenue forecasts. This is particularly acute for consumer discretionary, retail and service-based industries.
The ROIC Challenge: The combination of a tight labour market (persistent wage pressure) and weak consumer demand creates a difficult environment for maintaining or growing Return on Invested Capital (ROIC). Companies may lack the pricing power to pass on rising labour costs, leading to a margin squeeze. Capital expenditure plans must be scrutinised to ensure they can generate returns that meaningfully exceed the stubbornly high WACC.

Domain 3: The External Sector – Global Risks & Opportunities
The outlook for global trade has weakened, with downward revisions to both export and import growth. While the Australian Dollar has found a slightly firmer footing, the external environment remains a key source of risk that may not be fully captured by standard valuation models.
The Shift (What):
- Exports & Imports: The consensus forecast for 2025 growth in exports of goods and services has been sharply curtailed from 2.5% to 1.8%. Import growth has also been revised down from 2.3% to 2.0%.
- AUD/USD Exchange Rate: The year-end 2025 forecast for the Australian Dollar has been revised marginally higher, from USD 0.64 to USD 0.65.
The Valuation Impact (So What):
- Direct Earnings Headwinds: The weaker export outlook directly impacts the cash flow forecasts for mining, agriculture and education sectors. The slightly stronger AUD further compounds this by reducing the value of translated overseas earnings.
- Quantifying Geopolitical Risk: The forecast commentary explicitly flags rising global trade barriers, U.S. tariff policy and the health of China’s economy as key downside risks. For businesses with significant exposure to these factors, relying solely on a market-derived Beta may understate their specific risk profile. We advise boards to consider a specific risk premium (an “Alpha” adjustment) within their cost of equity calculation to more accurately reflect the potential for cash flow volatility stemming from these non-diversifiable geopolitical risks.
Domain 4: Terminal Value – The Long-Term Horizon
Perhaps the most strategic shift this quarter lies in the long-term forecasts that underpin Terminal Value, which often represents over 60% of a company’s total valuation. Here, we see two powerful and opposing forces creating a valuation “tug-of-war.”
The Shift (What):
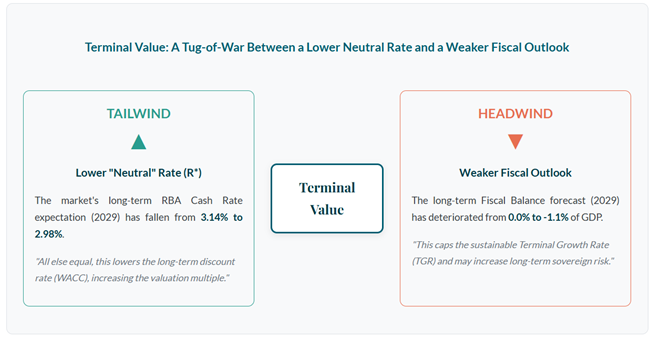
- The “Neutral” Interest Rate: Using the longest-dated RBA Cash Rate forecast (2029) as a proxy for the market’s view of the neutral rate (R*), we see a decline from 3.14% in the March report to 2.98% in the June report.
- Fiscal Sustainability: The long-term fiscal outlook has deteriorated significantly. The forecast for the 2029 Fiscal Balance has shifted from a balanced budget (0.0% of GDP) to a deficit of -1.1% of GDP.
The Valuation Impact (So What):
- A Tug-of-War on the Valuation Multiple: These two shifts create a critical tension.
- The Pull (Higher Value): A lower perceived neutral rate (R*) implies a lower long-term risk-free rate. This lowers the denominator in the perpetuity growth formula (WACC – g), leading to a higher terminal multiple and a higher valuation, all else being equal.
The Push (Lower Value): A deteriorating long-term fiscal trajectory suggests higher government debt issuance in the future. This will compete with private investment for capital, putting upward pressure on the long-term risk-free rate and potentially increasing corporate taxes. This structural headwind may force a more conservative view on the sustainable Terminal Growth Rate (TGR), capping long-term value.

Strategic Imperative: Boards must critically assess which of these forces will have a greater impact on their business over the long-term when sanctioning valuations and long-range strategic plans.
Disclaimer
This document is provided for informational purposes only and does not constitute professional advice. The economic forecasts and analyses presented are based on consensus data from FocusEconomics. These projections are subject to change and uncertainty.
The information contained herein has been obtained from sources believed to be reliable, but Market Line makes no representations or warranties as to its accuracy, completeness, or suitability for any particular purpose. Any reliance you place on such information is strictly at your own risk.
The economic projections and opinions expressed in this newsletter are general in nature and do not take into account the specific circumstances, financial situation, or particular needs of any individual or entity. They should not be construed as recommendations to make any investment decisions or to take any specific actions.
Market Line and its employees shall not be liable for any loss or damage, direct or indirect, arising from the use of or reliance upon any information contained in this newsletter.
© 2025 Market Line Pty Ltd (ACN 644 883 483) is Corporate Authorised Representative Number 1284459 of AFSL 3442034